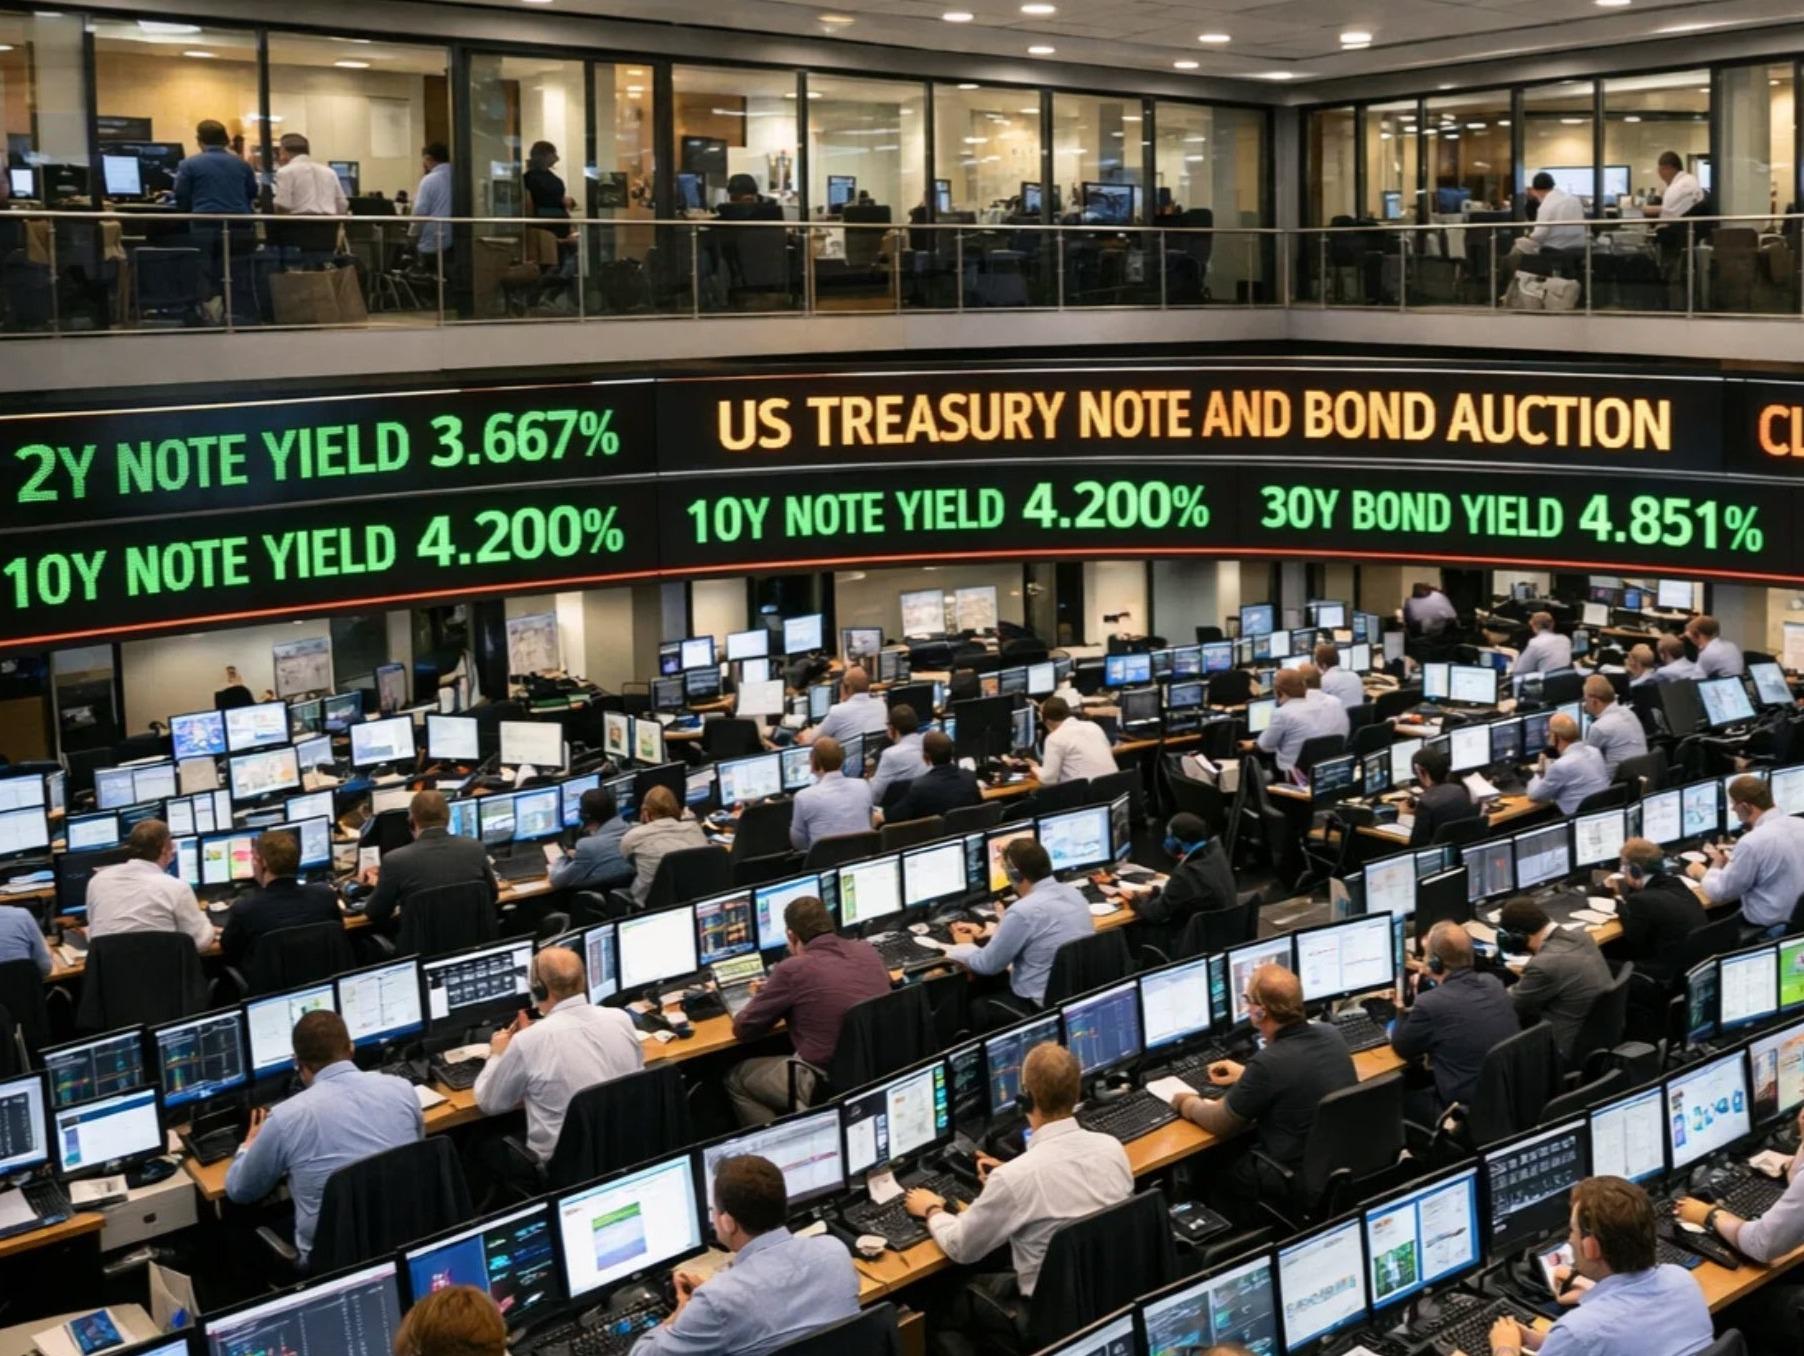
US treasury auctions off $13 billion of 20 year bonds at a high yield of 5.163%
<ul><li>High yield 5.163% </li><li>WI level at the time of the auction 5.158%.</li><li>Tail 0.5 basis points versus six month average of -0.3 basis points.</li><li> Bid to cover 2.64X versus average of 2.66X</li><li>Directs 10.21% vs average of 23.9%</li><li>Indirects 69.12% vs average of 65.9%</li><li>Dealers 14.67% vs average of 10.1%</li></ul><p>Auction Grade: D+(almost a D)</p><p>The positive tail, the domestic demand being much weaker than average and the dealer amount being higher are all negatives. The international demand was marginally better. The Bid to cover was near the average. </p><p class="PDq2pG_selectionAnchorContainer">Key Components of a U.S. Treasury Auction</p><ul><li>High Yield (Stop-Out Yield): Final accepted yield.
<ul><li>
Lower than expected = Strong demand</li><li>
Higher than expected = Weak demand</li></ul></li><li>Tail (vs. When-Issued Yield): Most watched metric.
<ul><li>Through (negative tail) = Very strong auction
</li><li>Positive tail = Weak auction
</li></ul></li><li>Bid-to-Cover Ratio: Total bids ÷ amount sold.
<ul><li>
Higher than average = Strong demand</li><li>
Lower than average = Weak demand</li></ul></li><li>Indirect Bidders: Foreign central banks and overseas investors.
<ul><li>
Higher participation = Strong foreign demand</li><li>
Lower participation = Weak foreign demand</li></ul></li><li>Direct Bidders: Domestic institutional investors.
<ul><li>
Higher participation = Strong domestic demand</li><li>
Lower participation = Weak domestic demand</li></ul></li><li>Dealer Allocation: Primary dealers absorb unsold securities.
<ul><li>
Lower allocation = Bullish (private demand strong)</li><li>
Higher allocation = Bearish (demand weak)</li></ul></li></ul><p>Strong Auction Signals</p><ul><li>
✔️ Auction clears through the WI yield (i.e. s lower than the WI level at the time of the auction </li><li>
✔️ High bid-to-cover
</li><li>
✔️ Strong indirect and direct bidding
</li><li>
✔️ Low dealer take
</li></ul><p>Typical Market Reaction: Treasury yields fall, bond prices rise, and stocks often benefit.</p><p>Weak Auction Signals</p><ul><li>
❌ Positive tail
</li><li>
❌ Low bid-to-cover
</li><li>
❌ Weak indirect/direct demand</li></ul>
This article was written by Greg Michalowski at investinglive.com.
This article was sourced from Forexlive. WealthWire aggregates financial news for informational purposes only. This does not constitute investment advice.